
Introduction
The GTK+ Profile Plotter is a stand-alone program designed to plot geographic cross-section data in a variety of formats. The Profile Plotter reads distance, elevation, and optionally color. The elevation plots relative to the distance, at a user controlled vertical exaggeration.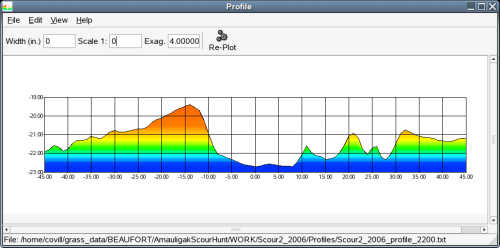
The program was originally developed to handle output from the GRASS program r.profile with the “-c” flag set. The original concept was to create a color-coded cross-section at a user defined vertical exaggeration that matched the GRASS raster map.
The program accepts numerous ASCII, space separated data. The Profile Plotter has been tested on both Linux and Windows XP systems.
Features
The Profile Plotter features include:
- Support for 5 ASCII data formats.
- Control for vertical exaggeration and image/plot size (pixels).
- Control of plot options including: axis min/max, axis color, and axis grid size.
- Save and open eXtensible Markup Language (XML) plot files.
- Save profile image as a Portable Network Graphics (PNG), Portable Document Format (PDF), Postscript format (PS), or Scalable Vector Format (SVG).
- Save over-sized profile image to tiles for printing over multiple pages.
The features listed above plus new features will be described in greater detail with future postings.