
Tekmap Consulting uses custom built software to process, map, and visualize in-stream tidal model data. The custom software uses the open source tools for FVCOM users, PySeidon.

Using PySeidon, Tekmap can offer a number of data products from Finite-Volume, primitive equation Community Ocean Model (FVCOM) data.
The data products include:
- Extract and visualize data in cross-section, map, and 3-D.
- Visualize and animate across time and depth.
- Output to GIS raster and vector products.
- Output to custom formats.
- Output cross-sections and time series.
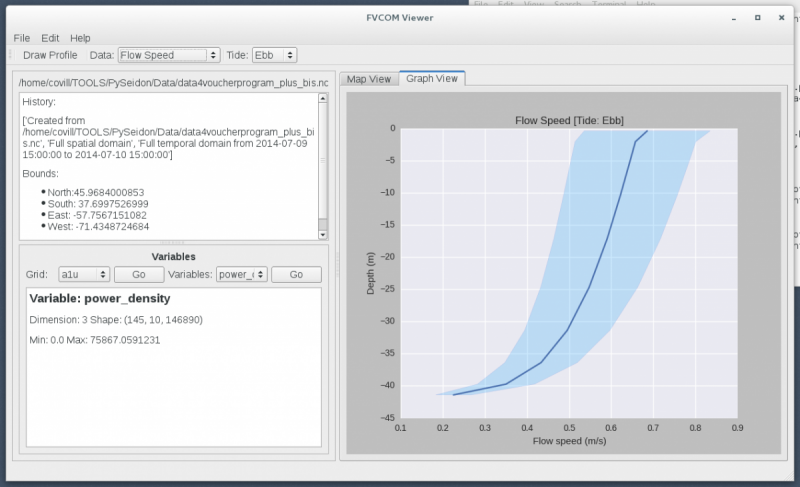
Power density profile between A and B over a 24 hour period.
Power density profile between C and D over a 24 hour period.