
In the previous post, I described how to import multibeam navigation and bathymetry into GRASS using the wxPython Graphical User Interface (GUI).

In this post, I describe how to accomplish the same basic import steps by using the GRASS command line interface instead of the GUI. If you are familiar with the command line interface, this process can be a lot faster.
The basic import steps are:
- Creating a data list and extracting navigation.
- Importing navigation into GRASS and setting the map region.
- Gridding the multibeam bathymetry.
- Assigning a color table to the gridded bathymetry.
- Creating a sun-illuminated bathymetry map.
- Creating a color-shaded bathymetry map.
Step 1: Creating a Data List and Extracting Navigation
Follow the same steps given in Step 1 in the previous post.
Step 2: Importing Navigation into GRASS and Setting the Map Region
- Import the navigation using v.in.ogr.
v.in.ogr dsn=sumnerloihi1997_navigation.shp out=sumnerloihi1997_navigation
- Set the GRASS Region to the imported vector
g.region vect=sumnerloihi1997_navigation
- Set the Region resolution to 50m.
g.region -a res=50
In the previous step, you may want to use the GUI to fine tune the region extents.
HINT: At this stage you could use g.region -bg to get the region bounds for use with the MB-System gridding program mbgrid.
Step 3: Gridding the Multibeam Bathymetry
-
 Import the multibeam bathymetry into GRASS using r.in.mb.

r.in.mb inp=SumnerLoihi1997_data_list.txt out=SumnerLoihi1997_Bathy_50m
NOTE: Use the same command with a "-a" flag to import mutlibeam backscatter.
(r.in.mb -a inp=SumnerLoihi1997_data_list.txt out=SumnerLoihi1997_Backscatter_50m)
Step 4: Assigning a Color Table to the Gridded Multibeam Data
- Use the r.colors command to assign a color table.
r.colors map=SumnerLoihi1997_Bathy_50m color=bcyr
HINT: The bcyr and haxby color tables work well for bathymetry, and the grey color table works well for backscatter and sidescan. The Histogram equalization flag "-e" can be used to distribute the colors evenly.
Step 5: Creating a Sun-illuminated Bathymetry Map
- Ensure the GRASS region is set to the imported bathymetry.
g.region rst=SumnerLoihi1997_Bathy_50m
- Run r.shaded.relief to create a grey sun-illuminated bathyemtry map.
r.shaded relief map=SumnerLoihi1997_Bathy_50m shademap=SumnerLoihi1997_Bathy_50m_shade alttude=30 azimuth=230 zmult=5
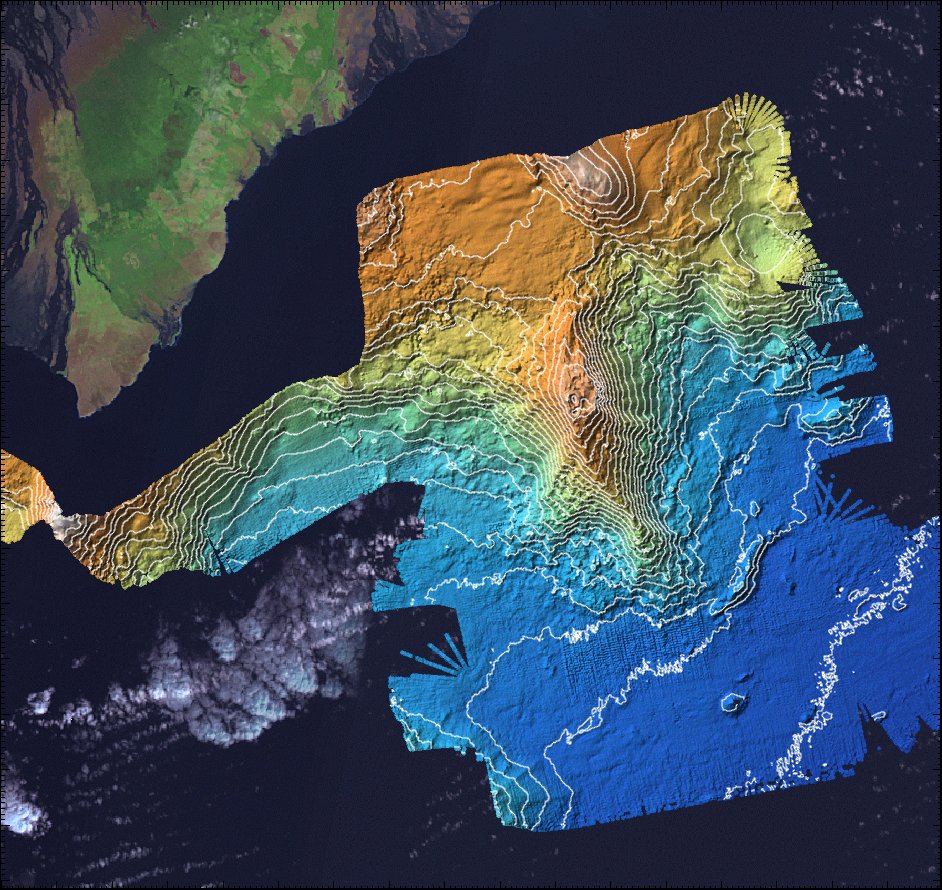
Step 6: Creating a Color Shaded Bathymetry Map
- Ensure the GRASS region is set to the imported bathymetry.
g.region rst=SumnerLoihi1997_Bathy_50m
- Using the r.his command combine the color (HUE) bathymetry created in Step 3 with the shaded (INTENSITY) bathymetry created in Step 5.
r.his -n h_map=SumnerLoihi1997_Bathy_50m i_map=SumnerLoihi1997_Bathy_50m_shade r_map=SumnerLoihi1997_Bathy_50m_red g_map=SumnerLoihi1997_Bathy_50m_green b_map=SumnerLoihi1997_Bathy_50m_blue
- Using r.composite combine the RGB output from r.his into a single map.
r.composite red=SumnerLoihi1997_Bathy_50m_red green=SumnerLoihi1997_Bathy_50m_green blue=SumnerLoihi1997_Bathy_50m_blue output=SumnerLoihi1997_Bathy_50m_combined
- [Optional] Remove the RGB maps created by r.his.
g.remove rast=SumnerLoihi1997_Bathy_50m_red,\
SumnerLoihi1997_Bathy_50m_green,\
SumnerLoihi1997_Bathy_50m_blue