
You are here
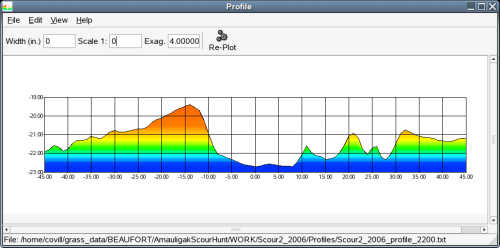
GTK+ Profile Plotter
|
Jun 17 2009 09:55
|
Jun 16 2009 09:51
|
|
Jun 11 2009 09:38
|
Jun 11 2009 09:24
|
|
Jun 11 2009 09:22
|
Jun 10 2009 09:12
|


